Blog
LiFePO4 Battery Voltage Chart (3.2V, 12V, 24V, 48V) Comparison
 Comparison 1")
A LiFePO4 battery voltage chart visually represents the relationship between battery voltage and its state of charge (SOC) across different voltages such as 3.2V, 12V, 24V, and 48V. It helps users monitor charge levels, optimize battery life, and prevent overcharging or deep discharging, ensuring safe and efficient battery usage.
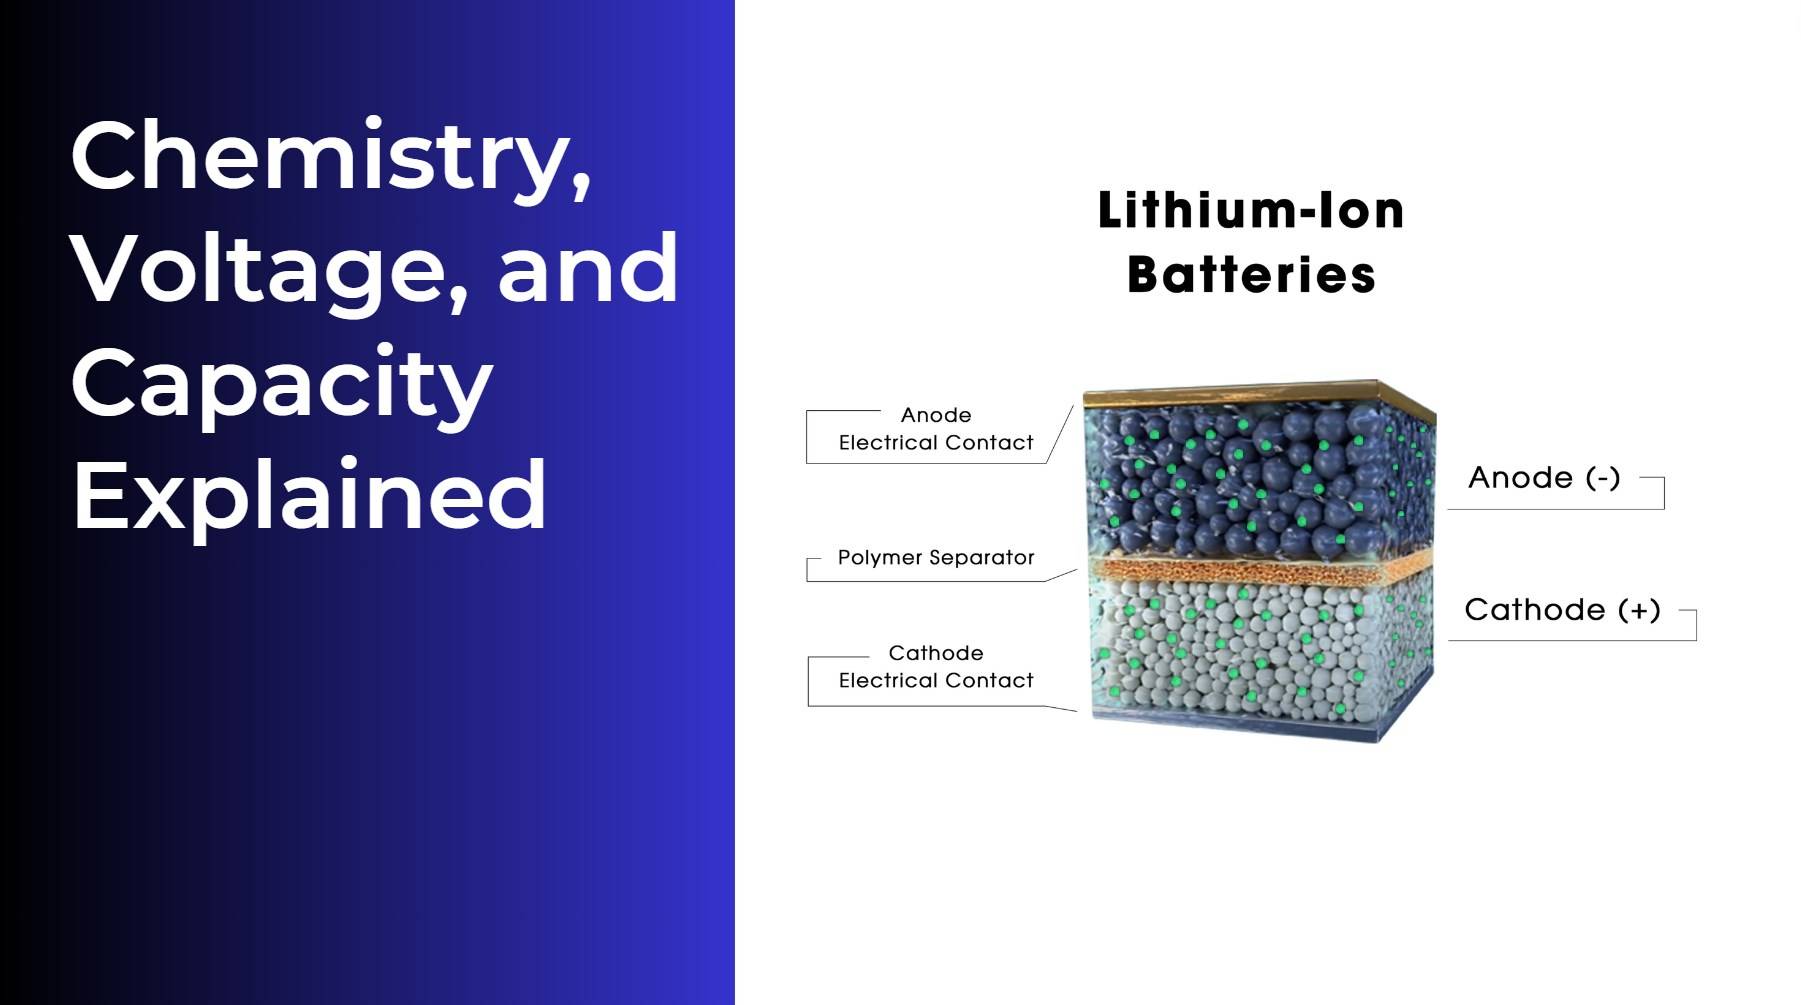
How Does the Voltage of a Single 3.2V LiFePO4 Cell Vary with Charge?
A single 3.2V LiFePO4 cell has a nominal voltage of about 3.2 volts, with a fully charged voltage around 3.65V and a typical cutoff (fully discharged) voltage near 2.5V. The voltage remains relatively stable during discharge, creating a flat discharge curve that prolongs usable battery life and offers consistent power output throughout most of its cycle.
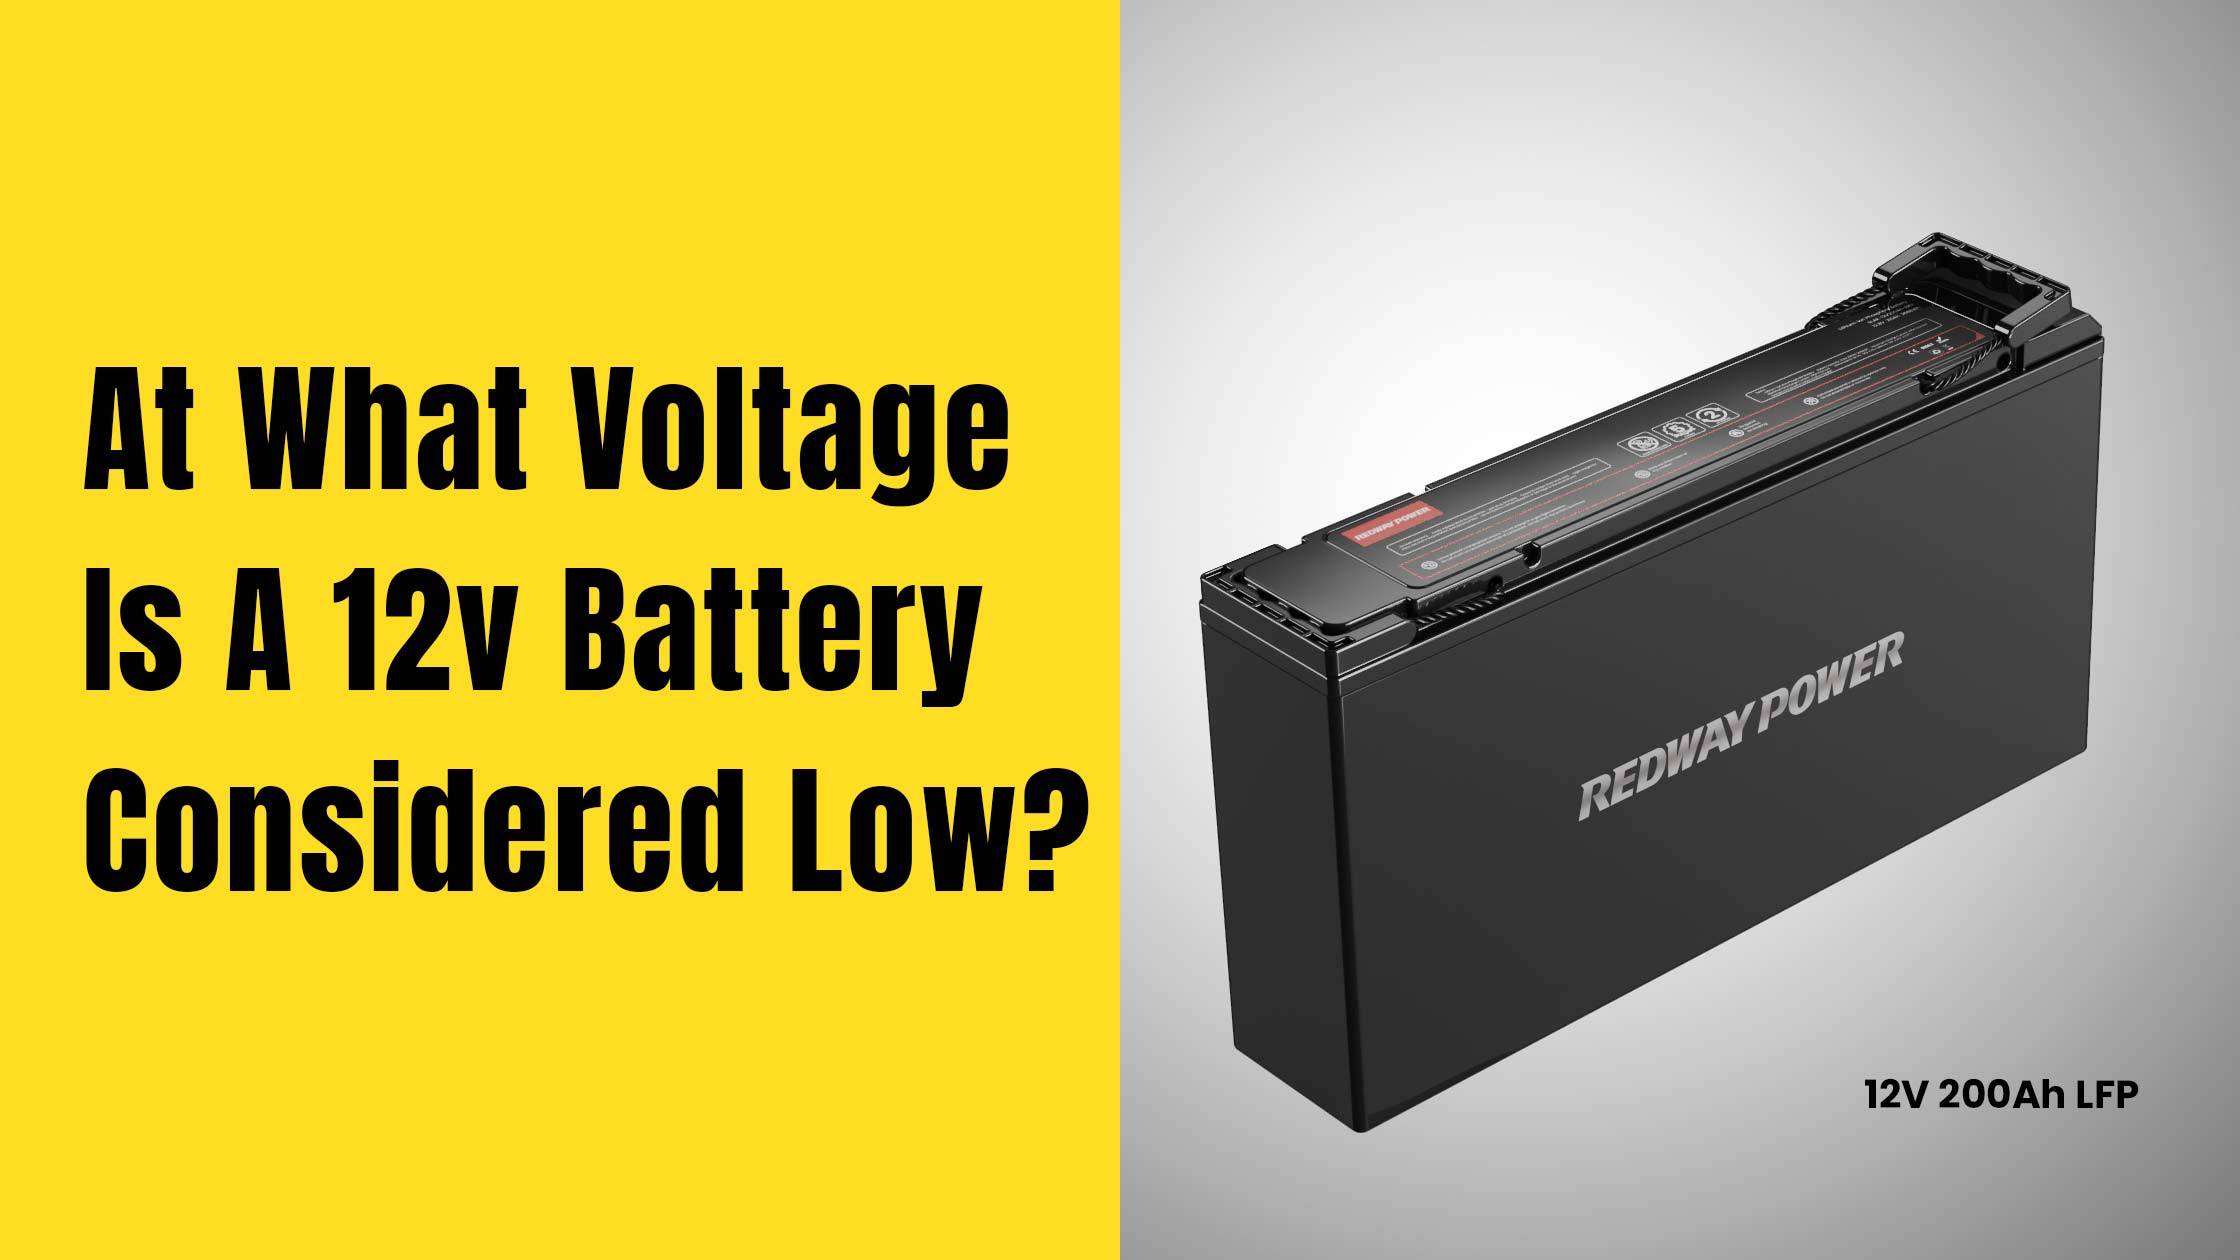
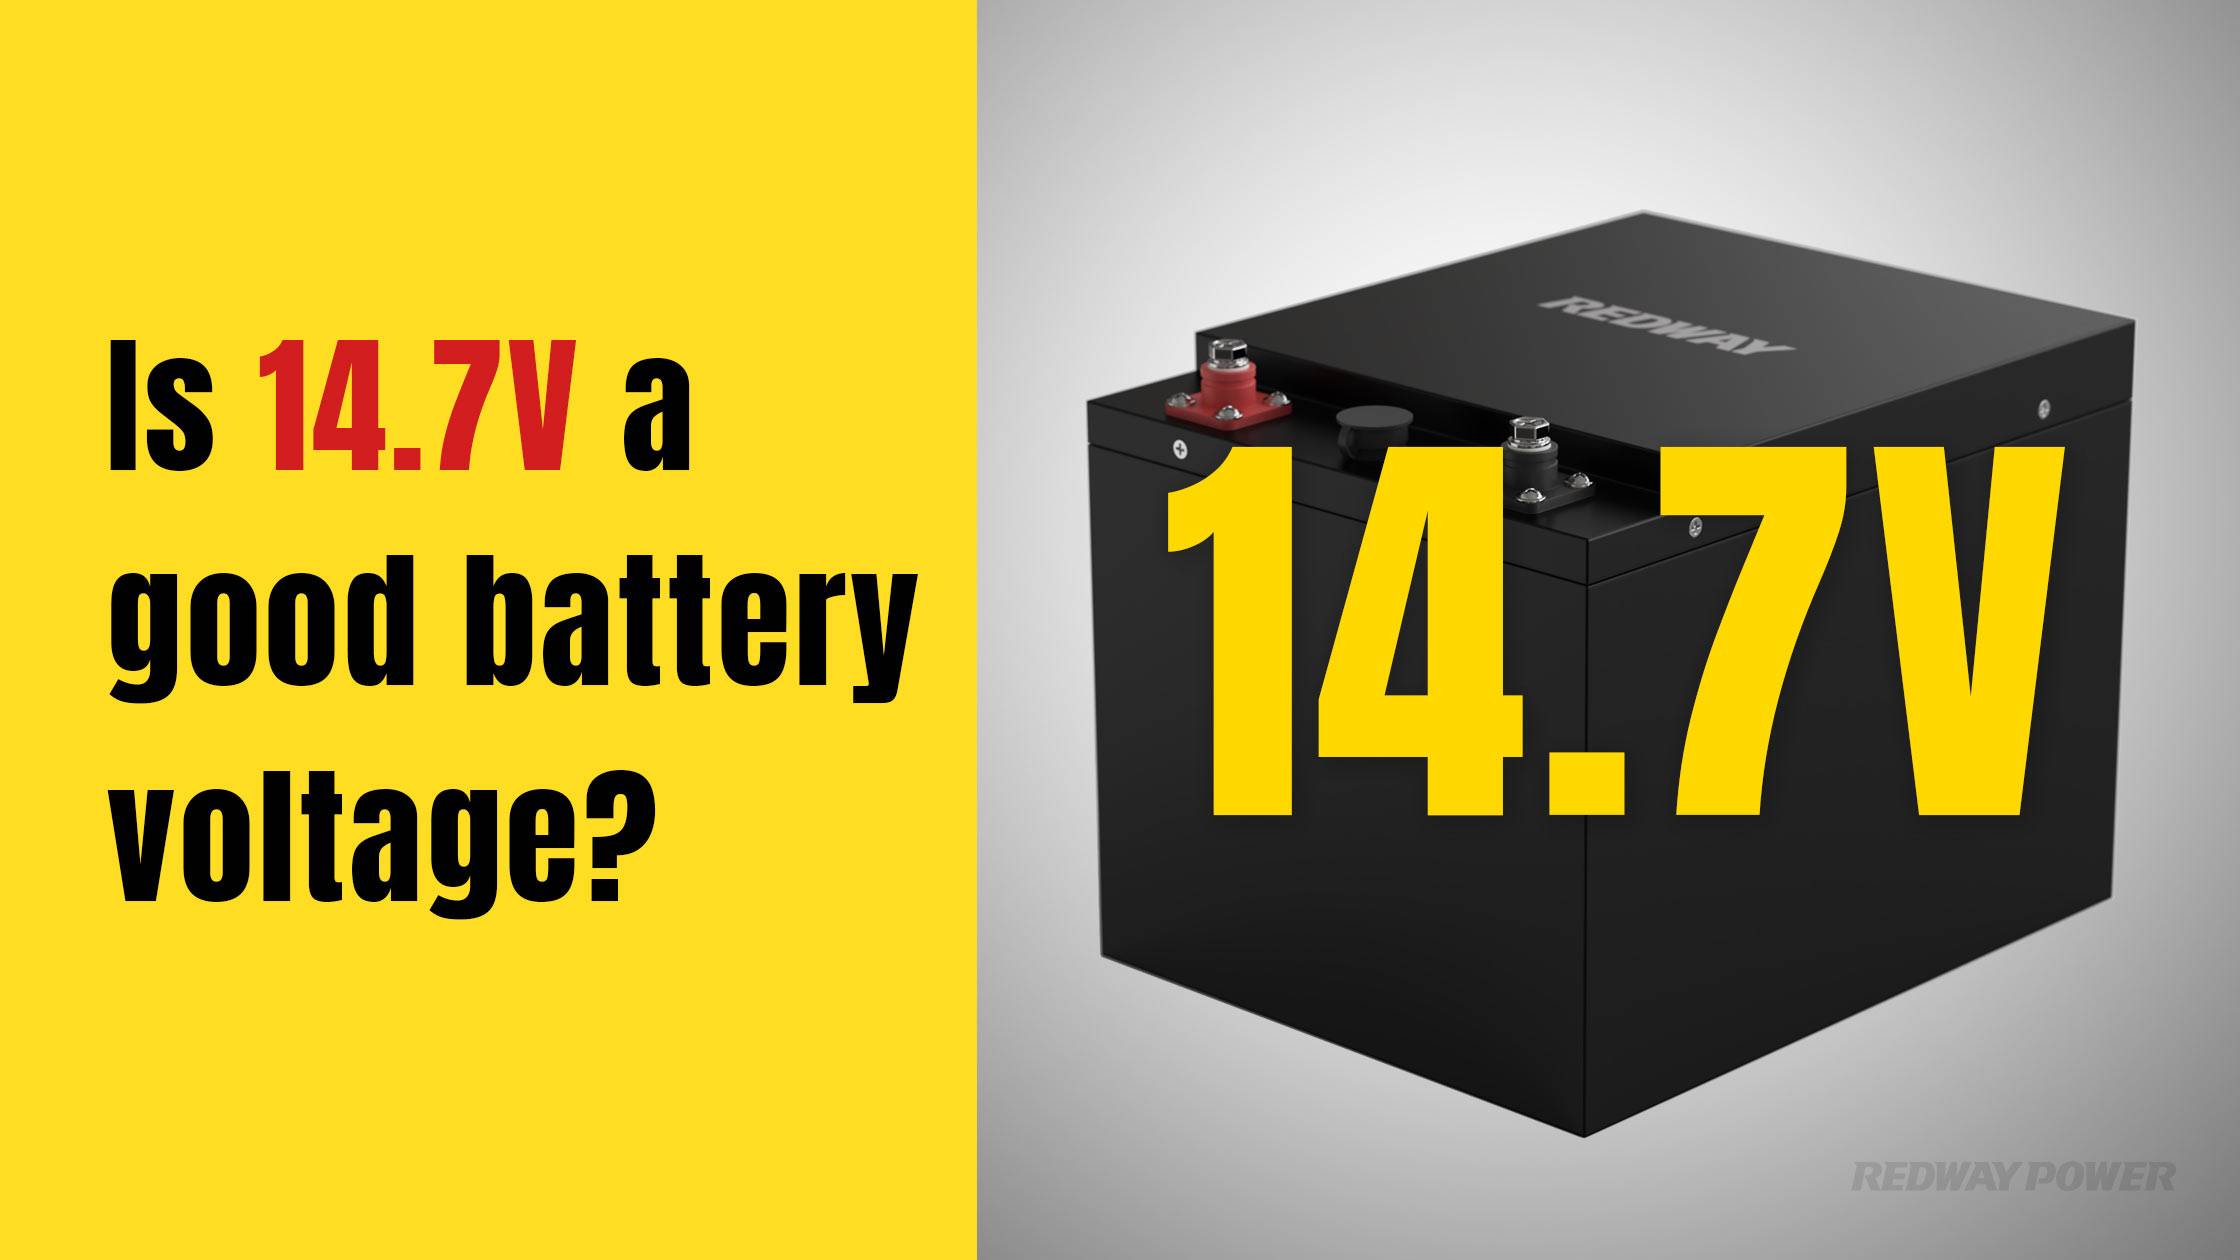
What Are the Voltage Characteristics of 12V LiFePO4 Battery Packs?
12V LiFePO4 packs, usually composed of 4 cells in series, have a nominal voltage near 12.8V. They typically charge fully at approximately 14.6V and discharge down to about 10V. This voltage range supports stable performance in home solar systems or smaller energy storage setups, with slow voltage drop-offs during most of the discharge cycle for efficient energy use.
How Do 24V LiFePO4 Battery Voltages Compare During Charge and Discharge?
A 24V LiFePO4 battery pack consists of 8 cells in series, with a nominal voltage around 25.6V. The full charge voltage peaks near 29.2V while discharge cutoff is close to 20V. This voltage range suits medium-sized energy storage or electric vehicles, maintaining stable voltage for most of the discharge to ensure reliable power delivery.
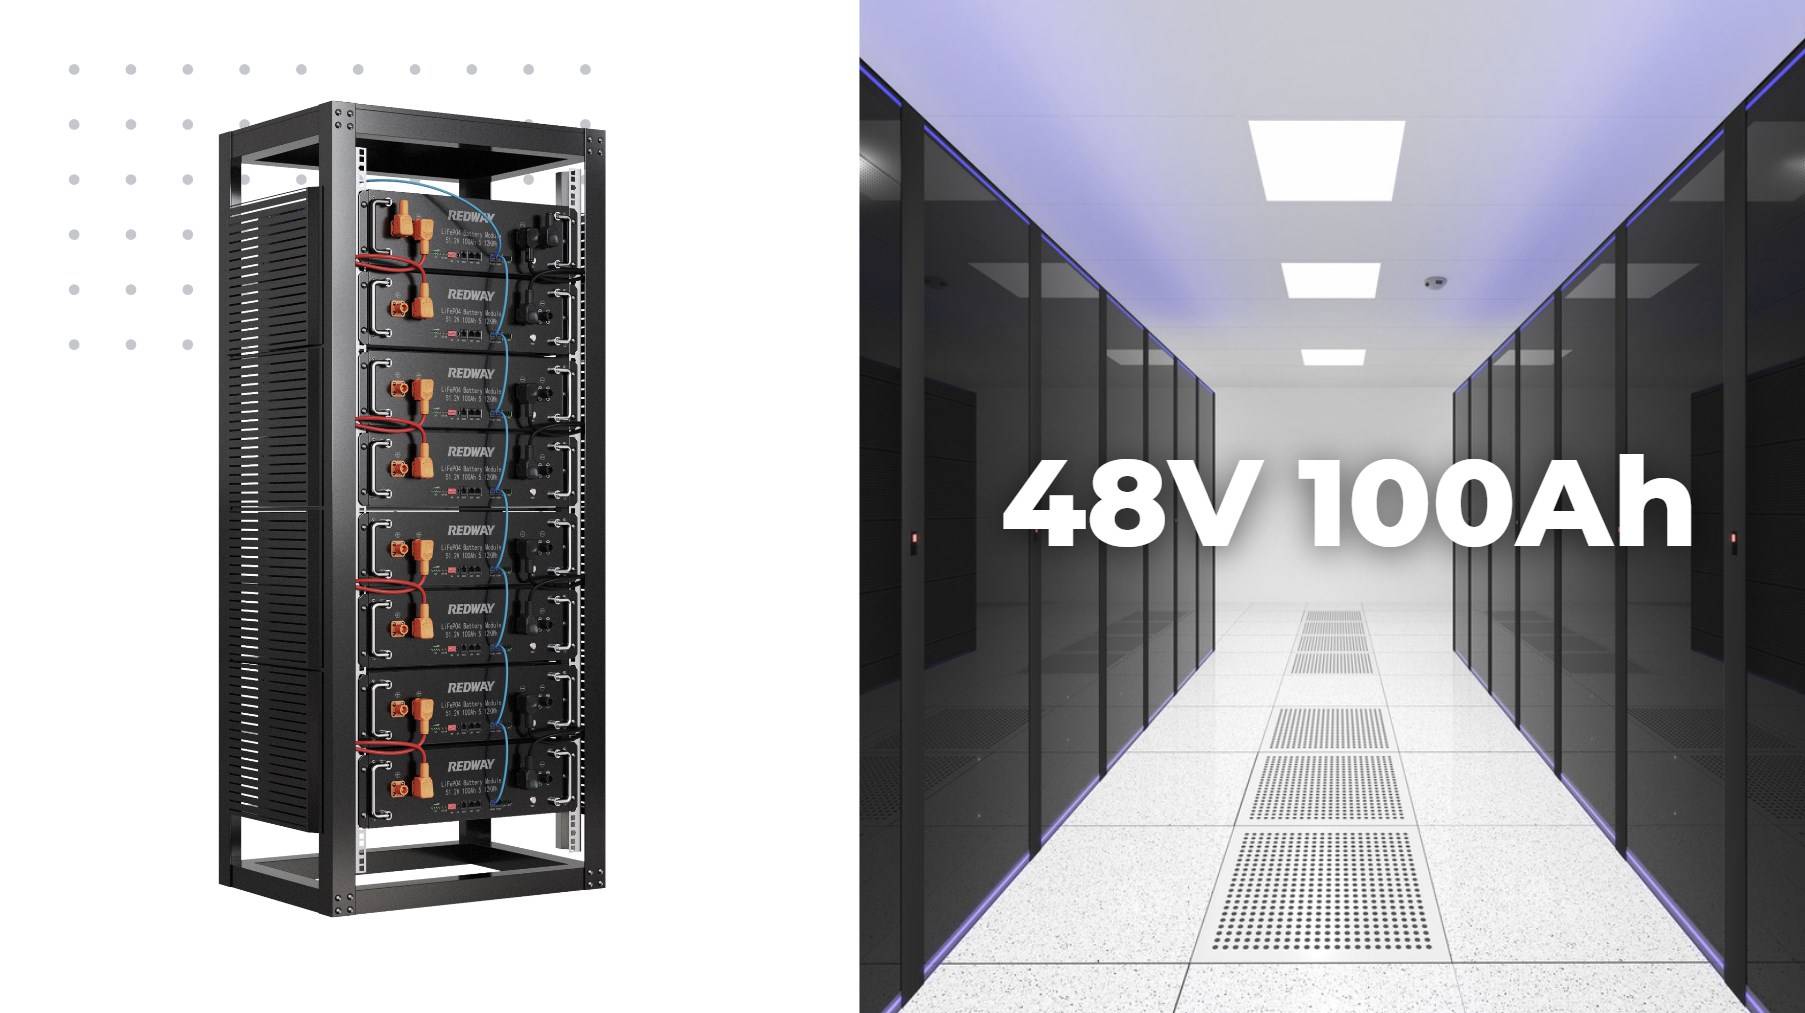
What Is the Voltage Range for 48V LiFePO4 Battery Packs?
48V LiFePO4 battery packs combine 16 cells in series, with a nominal voltage around 51.2V. When fully charged, voltage hits about 58.4V and discharges down to roughly 40V. These packs are ideal for large-scale storage systems, e-bikes, and electric vehicles. Their stable voltage performance across the charge cycle boosts equipment efficiency and longevity.
How Do LiFePO4 Battery Voltages Impact Performance and Longevity?
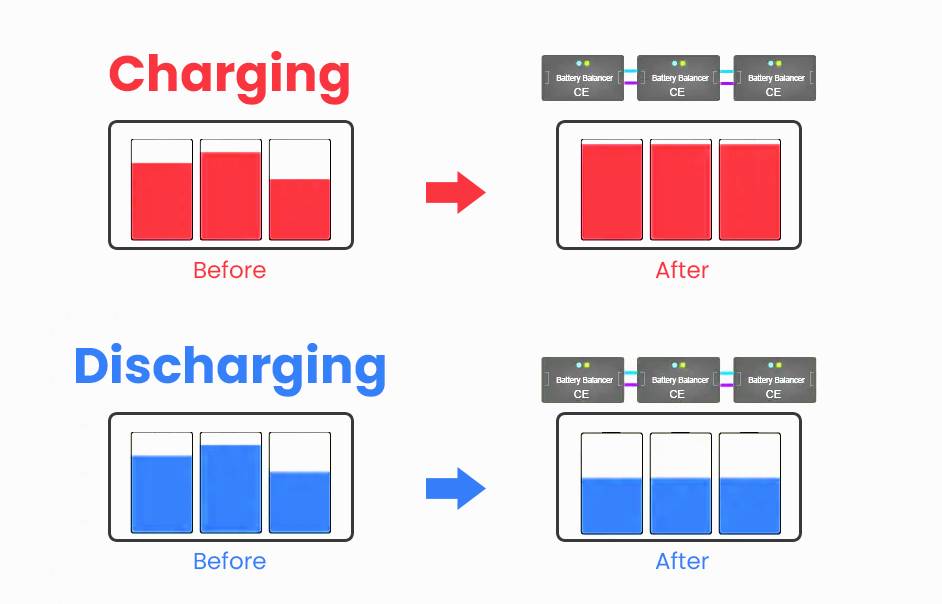
LiFePO4 batteries offer flat discharge curves, meaning voltage stays near nominal for most of their cycle, allowing devices to operate consistently. Maintaining voltage within optimal charge/discharge limits (not exceeding full charge voltage or falling below cutoff) prevents damage, extends cycle life (often 2000+ cycles), and improves safety compared to other lithium chemistries.
Voltage ranges and recommended operating points
| Nominal Voltage | Full Charge Voltage | Discharge Cutoff Voltage | Typical Cycle Life |
|---|---|---|---|
| 3.2 V (1 cell) | 3.65 V | 2.5 V | 2000+ cycles |
| 12.8 V (4S) | 14.6 V | 10 V | 2000+ cycles |
| 25.6 V (8S) | 29.2 V | 20 V | 2000+ cycles |
| 51.2 V (16S) | 58.4 V | 40 V | 2000+ cycles |
Which Applications Are Best Suited for Each LiFePO4 Voltage Level?
- 3.2V Cells: Used as building blocks in battery packs and small-scale devices.
- 12V Packs: Common in residential solar storage, UPS systems, and small electric vehicles.
- 24V Packs: Suitable for mid-range electric bikes, scooters, and larger solar setups.
- 48V Packs: Favored in EVs, marine applications, large energy storage, and industrial equipment.
How Does Redway Power Utilize Voltage Characteristics in Battery Pack Design?
With 13 years of industry experience and ISO 9001:2015 certification, Redway Power manufactures LiFePO4 battery packs with precise voltage management using advanced MES production systems. Their packs optimize charging voltages, maintain stable nominal voltages across various pack sizes (3.2V, 12V, 24V, 48V), and prioritize safety features to extend lifespan and performance consistency under diverse conditions.
What Safety Measures Are Important Across LiFePO4 Voltage Levels?
Safety relies on controlling charging voltage within manufacturer specifications to prevent overcharge, monitoring temperature, and ensuring proper cutoff voltages during discharge. Redway Power integrates protections like overcharge/overcurrent protection, temperature sensors, and robust casings rated for water/dust resistance, safeguarding batteries across all voltage sizes during normal and demanding use.
Redway Power Expert Views
“Understanding and managing the voltage characteristics of LiFePO4 batteries at every scale—from single 3.2V cells to high-voltage 48V packs—is crucial for maximizing safety, efficiency, and lifespan. At Redway Power, our precision engineering and advanced manufacturing systems ensure our battery packs deliver optimal voltage stability and durability, empowering customers in applications ranging from renewable energy to electric mobility.” – Senior Engineer, Redway Power
Conclusion
LiFePO4 battery voltage charts provide crucial insights into battery charge levels and performance at typical voltages such as 3.2V, 12V, 24V, and 48V. These batteries offer stable voltage during discharge, extensive cycle life, and enhanced safety compared to other chemistries. Choosing the right voltage suited to your application and managing charging properly—practices exemplified by Redway Power—ensures optimized battery life and reliable power for diverse needs.
FAQs
Q: What is the nominal voltage of a LiFePO4 cell?
A: A single LiFePO4 cell has a nominal voltage of about 3.2 volts.
Q: What voltages do typical LiFePO4 battery packs have?
A: Common pack voltages are 12.8V (4 cells), 25.6V (8 cells), and 51.2V (16 cells).
Q: Why is the voltage curve of LiFePO4 batteries considered ‘flat’?
A: Because voltage remains near nominal for most of the discharge cycle, providing consistent power output.
Q: How does Redway Power ensure LiFePO4 battery safety across voltage levels?
A: By integrating overcharge protection, temperature monitoring, and robust production quality standards in all battery packs.
Q: What happens if LiFePO4 batteries are discharged below cutoff voltage?
A: Over-discharging can damage cells, reduce cycle life, and cause safety issues.