- Forklift Lithium Battery
- Golf Cart Lithium Battery
- Rack-mounted Lithium Battery

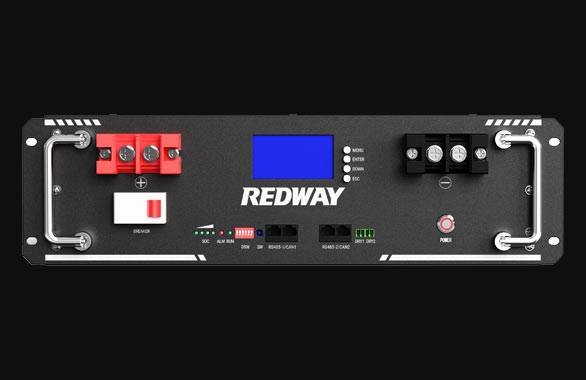
51.2V 100Ah Rackmount LiFePO4 Battery
8000 times (80% DOD 0.5C)
Optional SNMP for TELECOM - Car Starter Battery
- 12V LiFePO4 Battery
12V 150Ah Lithium RV Battery
Bluetooth App | Self-heating
LiFePO4 | Group 31
UL 1642 | IEC 62619 - 24V LiFePO4 Battery
- 36V LiFePO4 Battery
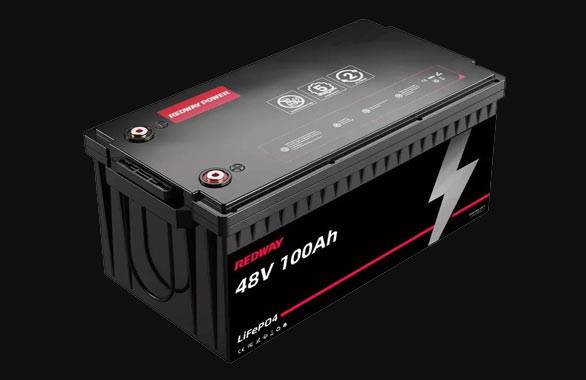
- 48V LiFePO4 Battery
- 60V LiFePO4 Battery
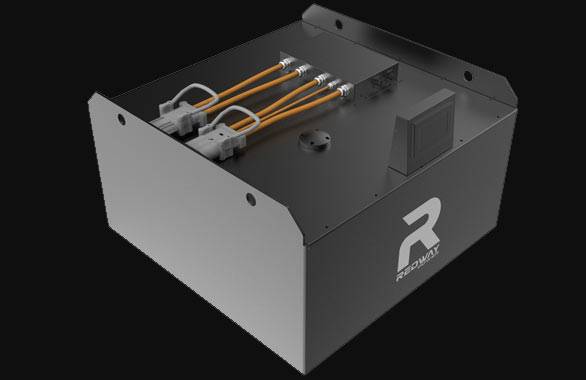
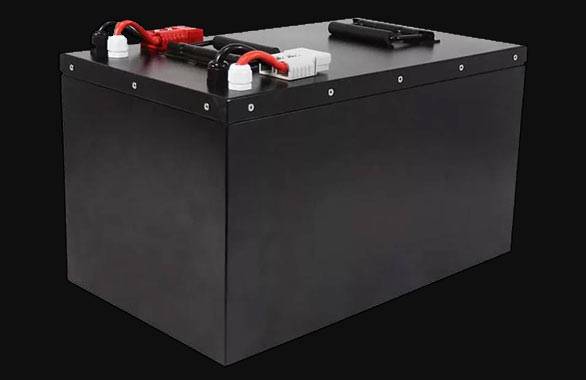
60V 100Ah Lithium Battery (AGV, AMR, LGV)
Peak Discharge Current 400A
500 x 298 x 349 mm - 72V~96V LiFePO4 Battery
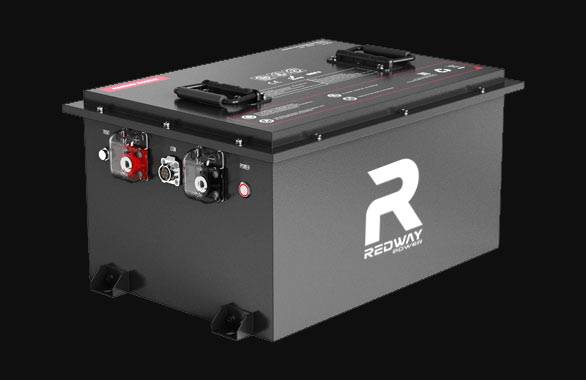
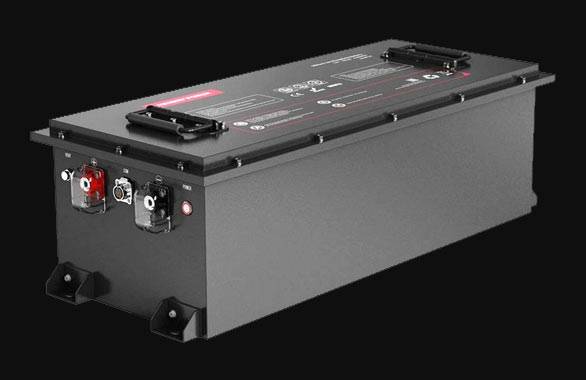
72V 100Ah Lithium Golf Cart Battery
Peak Discharge Current 315A (10S)
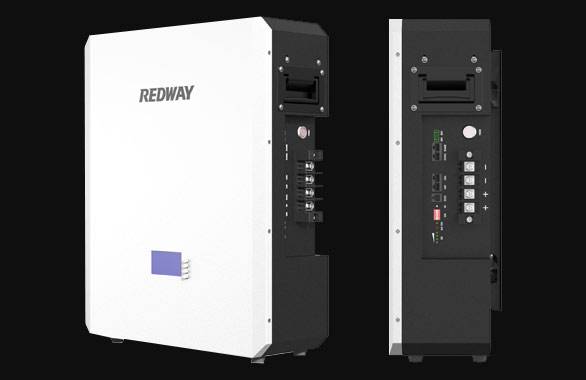
740 × 320 × 246 mm - Wall-mounted Lithium Battery
51.2V 100Ah 5kWh
Wall-mounted Battery532 x 425 x 170 mm / LiFePO4
>8000 Cycles (80% DOD 0.5C)
RS485 / CAN-bus
for Solar Home ESS
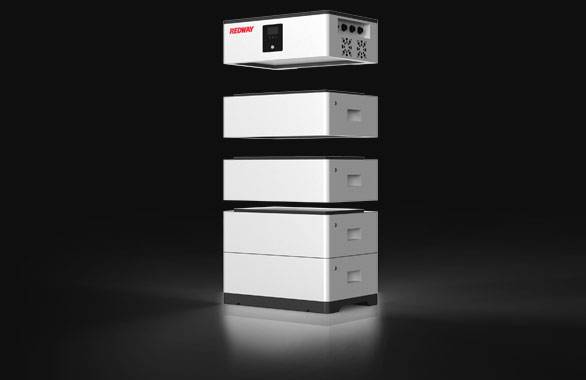
- Home-ESS All-in-One
51.2V 32kWh
All-in-On HESS SystemPowerAll
51.2V / LiFePO4
>8000 Cycles (80% DOD 0.5C)
RS485 / CAN-bus / WiFi
All-in-One for Home ESS

What Is A LiFePO4 Voltage Chart?
A LiFePO4 voltage chart illustrates the relationship between state of charge (SOC) and voltage for lithium iron phosphate batteries. These charts show nominal voltage at 3.2V/cell, charging cut-off at 3.65V, and discharge termination at 2.5V. The characteristic flat voltage plateau between 10%-90% SOC enables stable power delivery, with precise voltage monitoring required for accurate SOC estimation via Coulomb counting or advanced BMS algorithms.
72V 200Ah Golf Cart Lithium Battery

Why do LiFePO4 batteries have flat voltage curves?
LiFePO4’s olivine crystal structure creates stable lithium-ion insertion paths, maintaining voltage within ±5% during 80% of discharge. This contrasts sharply with NMC batteries that show linear voltage decline, making SOC estimation simpler but less precise.
The flat curve stems from minimal phase changes during charge/discharge cycles. Between 20-80% SOC, voltage hovers around 3.2-3.3V/cell – a 3% variation compared to NMC’s 15% swing. Pro Tip: Use temperature-compensated voltage readings during battery calibration at 50% SOC (3.3V) for optimal accuracy. For example, a 24V LiFePO4 pack maintains 25.6-26.4V through 70% of its capacity, ideal for solar systems requiring steady voltage input to charge controllers.
How does temperature affect LiFePO4 voltage readings?
Voltage drops 2-3mV/°C per cell below 20°C, requiring BMS compensation. At -20°C, a 3.2V cell may read 3.0V, falsely indicating 20% SOC loss. Above 45°C, self-drain increases 0.1V temporarily.
Between -10°C to 50°C, the operational window narrows voltage accuracy to ±7%. Always account for thermal drift using temperature-synchronized BMS – uncorrected readings at 0°C can overstate capacity by 18%. For instance, a cold 12V battery showing 12.0V might actually hold 80% charge rather than 50%. Warning: Never charge below 0°C without preheating systems to prevent lithium plating.

| Parameter | 24V System | 48V System |
|---|---|---|
| Full Charge Voltage | 29.2V | 58.4V |
| Nominal Voltage | 25.6V | 51.2V |
| Discharge Cut-off | 20.0V | 40.0V |
What voltage indicates 50% capacity in LiFePO4?
At 50% SOC, individual cells measure 3.29-3.31V under load. For 48V packs (15S), this translates to 49.35-49.65V – a 0.6% window requiring precision voltmeters for accurate measurement.
Resting voltage at 50% is typically 3.30V/cell (±0.02V). However, charge/discharge history affects this – a rapidly discharged battery might show 3.25V, while one at equilibrium reads 3.30V. For example, a 100Ah battery discharging at 50A will display 3.27V during operation but recover to 3.31V after 30 minutes rest. Pro Tip: Conduct capacity tests at 0.2C discharge rates for reliable voltage-SOC correlations.
How do series configurations impact voltage charts?
Series connections multiply cell voltage while maintaining capacity. A 16S 48V system’s full charge voltage reaches 58.4V (16×3.65V), with cell imbalance potentially creating ±1V deviations requiring active balancing above 3.45V/cell.
In 8S 24V configurations, the 20-80% SOC range spans 25.6-26.4V. Cell variations over 0.05V require balancing – a 0.1V difference in one cell creates 1.6V pack imbalance. For example, a 24V bank with seven cells at 3.3V and one at 3.2V shows 25.7V total, mimicking 60% SOC instead of true 65% capacity.
| Cell Count | Nominal Voltage | Capacity Impact |
|---|---|---|
| 4S | 12.8V | ±5% SOC error |
| 8S | 25.6V | ±3% SOC error |
| 16S | 51.2V | ±1.5% SOC error |
Redway Battery Expert Insight
LiFePO4 voltage charts require context-specific interpretation – our BMS systems incorporate dynamic compensation algorithms adjusting for load current, temperature history, and cycle count. Redway’s 72V systems implement cell-level voltage monitoring with ±0.5% accuracy, ensuring reliable SOC estimates even during high-current operations common in EVs and industrial equipment.
60V 100Ah Lithium Battery for E-Mobility
FAQs
Can I use voltage alone to check LiFePO4 health?
No – capacity testing under load is essential. Voltage only indicates surface charge; a 3.3V cell might have 90% capacity or 70% if internal resistance has increased.
Why does my battery show 3.4V but won’t hold load?
High internal resistance creates voltage sag – test under 0.5C discharge. If voltage drops below 2.8V/cell immediately, consider cell replacement.
⚠️ Critical: Never charge LiFePO4 above 3.65V/cell without active balancing – permanent capacity loss occurs beyond 4.0V.